What a code-history graph is counting
A large drop in the analyzer's own history leads back to a template extension, a counter's rules and the meaning of a line of code.
On this page
The code-history analyzer produces a fairly dramatic graph of its own history. At one commit, its JavaScript count falls from 4,398 lines to 1,684. The number of recognized files goes up at the same time, from 17 to 27. Before calling that a large deletion, it helps to follow the count back to the files.
This is a look back at the analyzer’s February release, with fresh counts made on 2 October using scc 3.7.0. There are six commits in the public history, which is a conveniently small set to inspect in full.
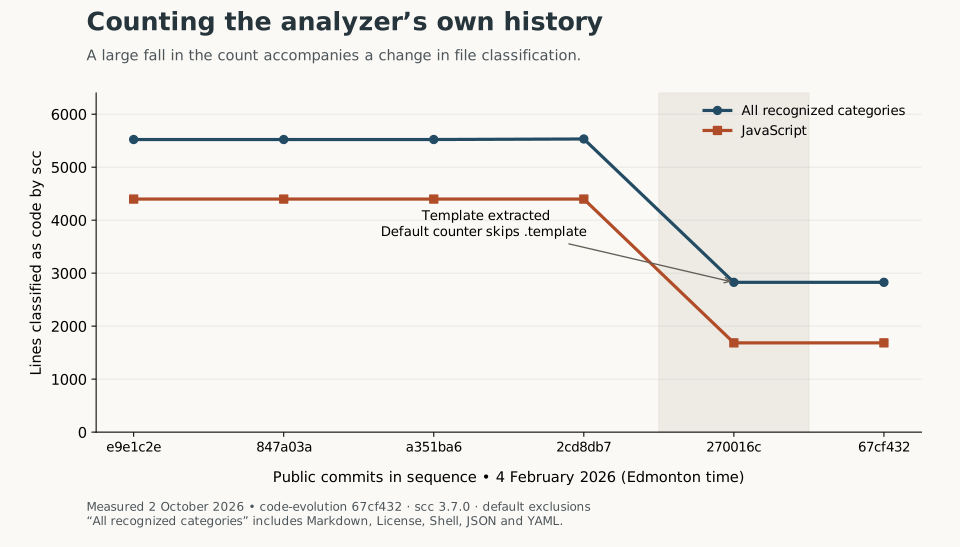
Measured with the analyzer’s default exclusions. “All recognized categories” includes Markdown and licence text classified by the counter, as well as programming languages. These counts do not measure useful functionality. Download the six rows as CSV.
From a commit to a point on the graph
The analyzer checks out a commit in a temporary worktree, runs the counter over that snapshot and records the per-language results. Repeating that for the history produces the data used to generate the visualization.
In this version, the counter adapter excludes common generated or dependency directories and explicitly tells scc how to classify .editorconfig. It otherwise relies on the counter to recognize the files. The total plotted by the analyzer is the sum of each recognized category’s code field, so blank lines, comments and unrecognized files do not contribute to it.
That last part explains much of the cliff. Commit 270016c splits the large analyzer into modules and moves the visualization into templates/visualization.html.template. The new file has 2,829 physical lines, but the default counter skips its extension.
You can see that directly with these two commands, run at the pinned revision:
scc templates/visualization.html.template --format json --no-cocomo
scc templates/visualization.html.template --format json --no-cocomo \
  --count-as 'template:HTML'
The first returns an empty array. The second returns an HTML result:
| Classification | Code | Comments | Blank | Physical lines |
|---|---|---|---|---|
| Default extension detection | Not counted | — | — | — |
Explicitly treat .template as HTML | 2,417 | 2 | 410 | 2,829 |
The 2,417 HTML code lines aren’t directly interchangeable with the 2,714 JavaScript lines that disappeared from the earlier count. The refactor changed files and classification, and an HTML template has different commenting and parsing rules. Still, the probe is enough to establish that a substantial part of the visualization continued to exist in a file the original measurement no longer included.
Changing the classification rules also raises a question about the rows already saved in data.json. If later commits include templates while earlier counts still omit them, the graph would compare snapshots measured in different ways.
Reusing counts means keeping the rules straight
The analyzer saves data.json, so another run can retain old snapshots and count commits added since the last recorded hash. Running the analyzer again without changing the repository or counting settings reuses the existing results. That is useful when most of a long history hasn’t changed.
There are several conditions that force a rebuild in the incremental path: a changed data schema, a different repository, a different counter tool, or a previous commit hash that can no longer be found. The exact counter version and every classification option aren’t part of that check, though. Switching the extension mapping while retaining old rows could therefore compare points produced under different rules.
For a comparison I want to reason about, I’d keep the counter version and options with the data, and recount the relevant history when those rules change. The retained CSV here identifies the commits; the figure’s caption records the tool version and the measurement date.