Code Evolution Analyzer
Visualize how code evolves over time by analyzing Git repository history with interactive charts and audio sonification.
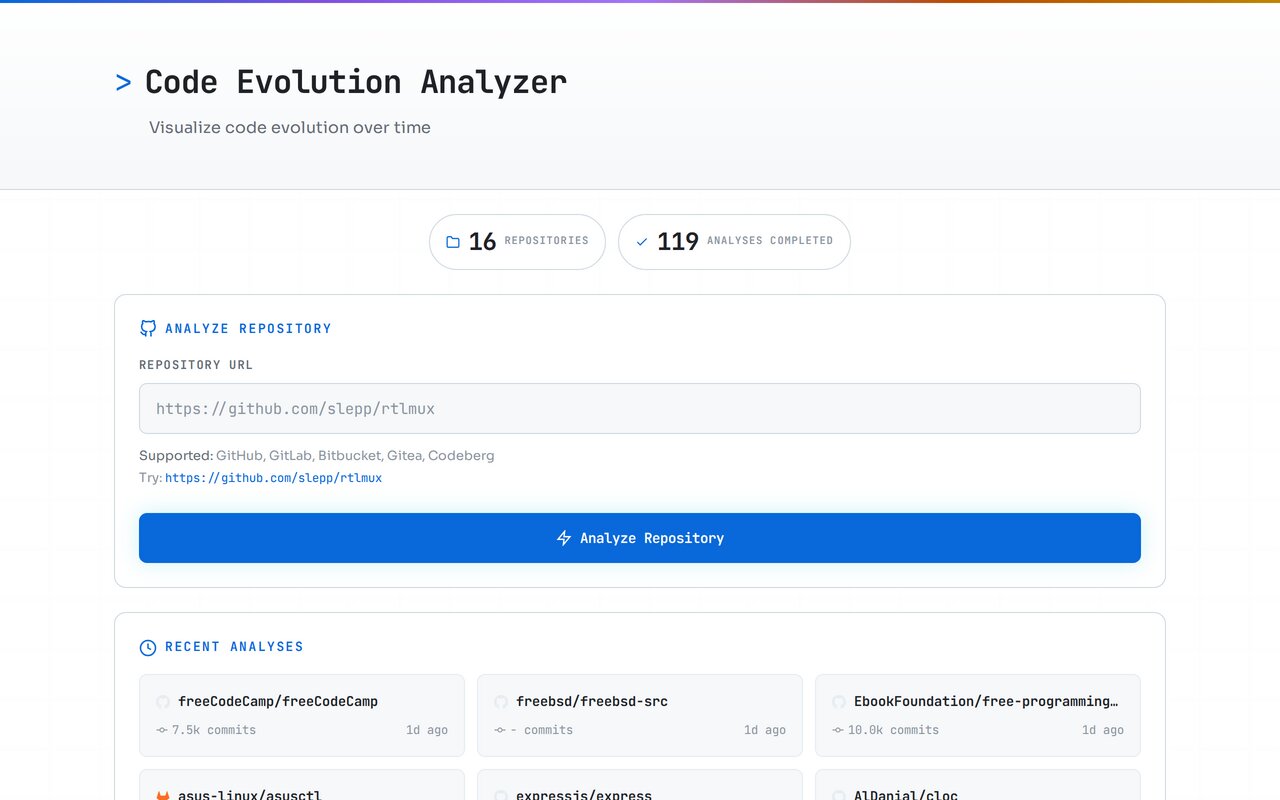
Give the analyzer a public Git repository and it replays the codebase commit by commit: which languages appeared, which ones took over, when the test suite arrived, when somebody committed a pile of generated code. I wanted to watch a repository grow rather than count what happens to be in it today.
There is also sound. Each language becomes a voice in a slowly shifting chord, so a repository that changes character over its history is something you can hear happening.
Using it
Paste a repository URL — GitHub, GitLab, Bitbucket, Codeberg, and others work — and a worker clones it and walks up to the last 2,000 commits on the default branch. Progress arrives over a WebSocket while it runs, which matters because a large repository takes several minutes. Repeat requests come back from an LRU cache almost immediately.
The limits are deliberate: public repositories only, under 1GB, and a cap on commit count. You can view lines of code, file counts, or byte totals, with animated playback across the history.
Why it is not just a loop over git checkout
The first version ran cloc on every commit. On a repository with roughly 10,000 files and 2,000 commits, that took twenty minutes, which is the kind of number that quietly kills a design: if collection is that slow, no amount of clever rendering matters.
Swapping in scc brought the same repository down to about fifteen seconds — roughly 80 times faster, from changing one command. Everything else in the project only exists because that loop became affordable.
Rendering had a similar moment. Chart.js redraws the whole chart on every update, which is fine for a static chart and hopeless for a 30fps animation over thousands of commits. The current renderer is custom Canvas 2D with data decimation, so the number of segments drawn stays bounded no matter how long the history is.
Architecture
Browser (Lit + Tailwind)
    │ HTTP/WebSocket
    ▼
API Service (Express 5) ──NATS JetStream──▶ Worker(s)
    │                                          │
    ├───────────────PostgreSQL─────────────────┤
    │                                          │
    └───────────────Redis (Dragonfly)──────────┘
Analysis jobs go through NATS JetStream with at-least-once delivery, and workers report heartbeats so a job whose worker dies gets picked up rather than sitting forever. PostgreSQL holds job state and repository metadata; Dragonfly handles caching and deduplication.
The CLI version is a different shape: a single 3,500-line JavaScript file that emits one self-contained HTML file with the visualization embedded as a template literal. No build step, no dependencies in the output.
Audio
Sixteen oscillators are tuned to a I-V-vi-IV progression, with beat-synced drums for a rhythmic grid. The interesting part is the gain curve: scaling volume linearly with line count leaves minority languages inaudible, so gain is scaled perceptually and the voices are spread across the stereo field to keep them distinguishable.